 (For more on growing your agency, please check out our free "Home Care Growth Best Practices" resource.)
Home Care Growth Measurements - the most important ones!
- Growth: Hours per week and revenue are the key ones. Note that you might think that number of clients should be on that list as well, but remember that an agency with 5 24x7 clients has more revenue than an agency with 80 10-hour per week clients.
- Gross-Margin: One of the most troubling statistics in the Home Care Pulse Home Care Survey has shown that the profit margins of home care agencies have been dropping in the past two years. It's not surprising because there's increased demand for home care and there have been fewer available caregivers so the amounts we're paying caregivers have gone up. To combat this, agencies need to charge more and look hard at the cases where the caregiver pay or overtime is eating up all the revenue.
- Operations: Most of our agencies use electronic clock-ins and clock-outs. On the Medicaid side this is called Electronic Visit Verification (EVV) but essentially all of our clients (including agencies who mostly support private pay and long-term care insurance) are doing it to have real time status and to streamline billing and payroll.
- Billing for All Available Hours: One metric that some but not all agencies track is whether they're delivering and and getting paid for all of their available hours. Again jumping to the Medicaid side, most Medicaid agreements come with a specifically authorized number of hours (or units) per week or month and the way Medicaid works is that you are encouraged to deliver all the hours be penalized if you go over. Most of you private duty folks are probably counting your blessings that you don't have to deal with that, but a nice thing about it is that it establishes a target number of hours for the agency and let's you know that you're getting it done.
What Metrics are Recommended by Home Care Growth Champs like Home Care Evolution by Steve the Hurricane?
Coincidentally, we recently we were joined by Melissa Bagley, one of the expert coaches from Home Care Evolution, on our Home Care Heroes Podcast. You can listen to her episode here:
Two follow-up thoughts:
- If there's no way you're going to listen to the podcast, Melissa's recommendations are totally in line with the list above :)
- If you think Podcasts aren't your thing, you might want to reconsider for the reasons that A) Home Care leaders spend a good amount of time in the car visiting prospects, referral partners and clients, and B) Rather than listening to news (which is mostly bad news), podcasts are educational and uplifting.
Best Practices: Dashboards should summarize information so you can get an immediate sense of how things are going
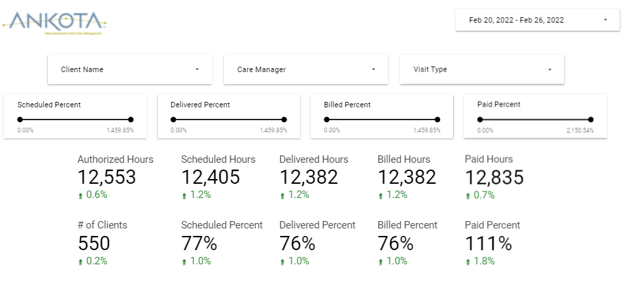
This dashboard answers the question "Are we delivering and getting paid for all the services we've been asked to deliver." It's a powerful end to end measure of operational efficiency. The numbers move left to right so that if there are issues you can see exactly where they're occurring.
Best Practice: Summaries are great, but you need drill down to see where the problems are
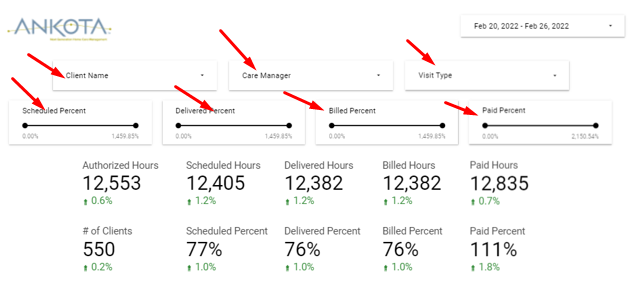
Referring to the same dashboard, note that it's great to see a summary, but you also need to be able to drill down to see where the issues lie. This dashboard has 7 ways you can drill deeper.
Best Practice: Graphs are Nice but Managers generally prefer numbers
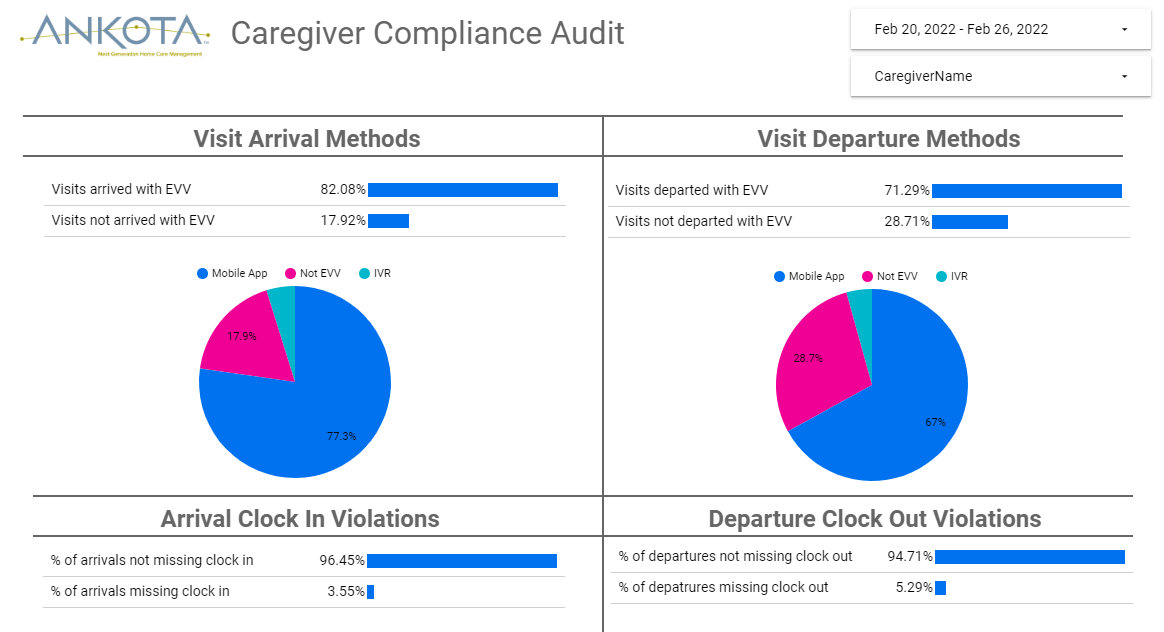
This view of caregiver compliance let's management know at a glance how their caregivers are doing with clock-ins and clock-outs. In this case the pie charts are very useful.
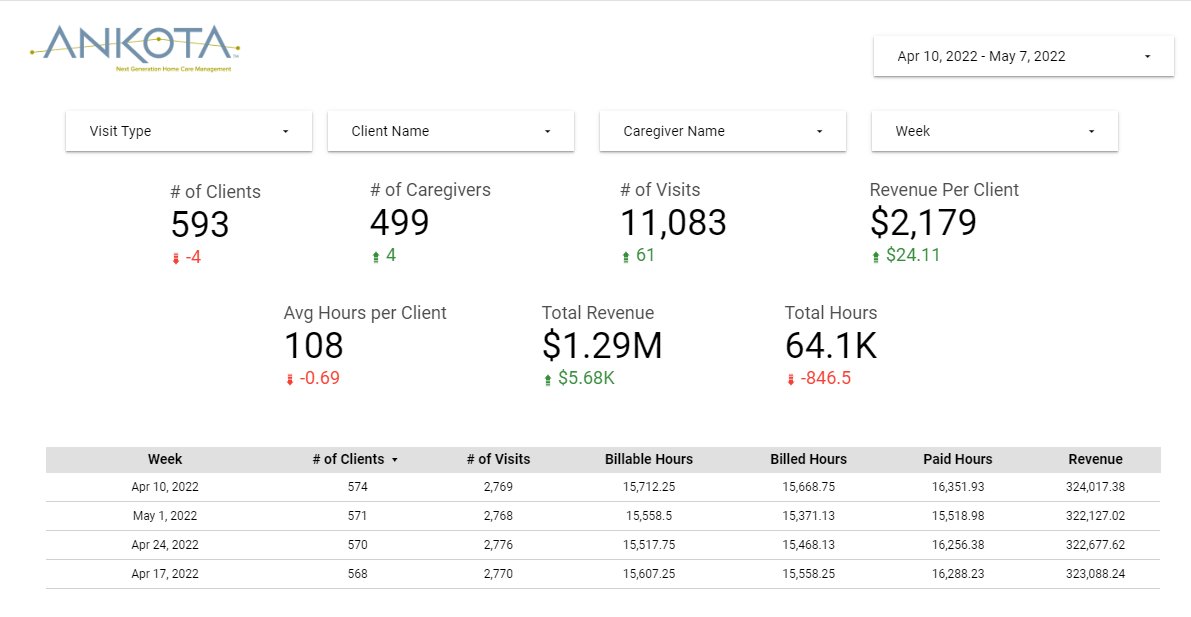
By contrast, managers generally prefer numbers and pride themselves on knowing their numbers off the top of their head. Overall business owners can usually tell you their number of clients and weekly hours, whereas recruiters can tell you their number of applicants, number of hires, percentage of candidates attending interviews and percentage hired. Here's a pure numbers dashboard with week by week data.
Best Practice: Manage by week, but be prepared to provide data by month, quarter, and other ways.
Here's a weekly summary of growth with week over week comparisons, but monthly results can be shown with the touch or a button.
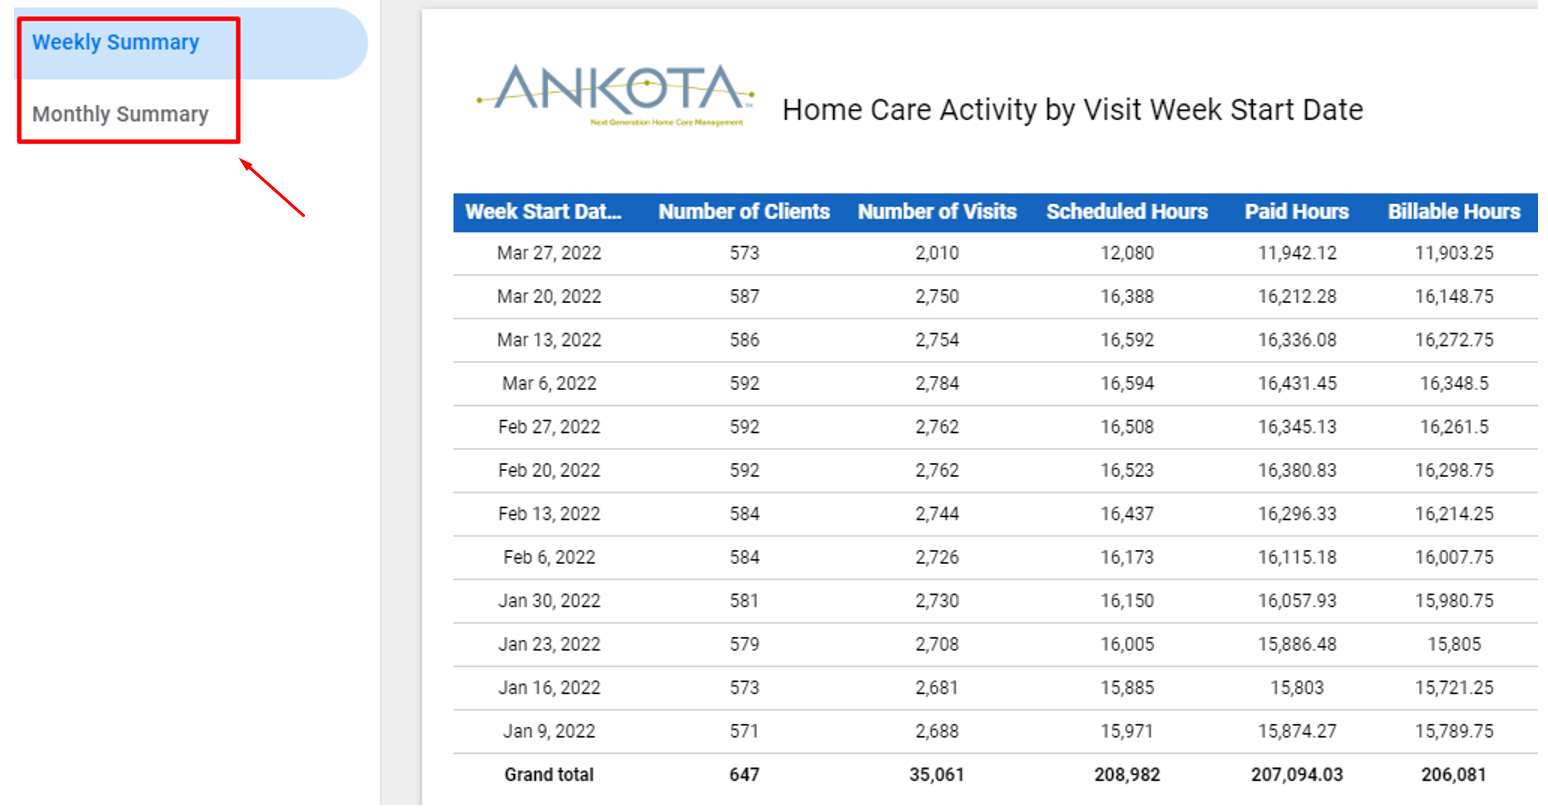
Similarly, you want to be able to look at pretty much any time period, but we recommend not looking at less than a week's worth of data because most agencies have fewer visits on the weekends.
Takeaways:
My church pastor once told me that no matter what sermon they were writing, the initial outline was "What?, So What? and Now What?" So, what should you do after reading this article. Here it is:
- Identify your key metrics - if you're not sure where to start go with weekly clients, weekly hours of care, gross margin, and recruiting
- Find an easy way to see the data - hopefully via dashboards with drill down as explained above (if you don't have this, we'd be happy to help - here's how to contact Ankota).
- Assign leaders to own and drive each of your key metrics
- Review them regularly, ideally week by week
If you have any questions about dashboards or how Ankota's home care management software can help your business, please click below to contact us!
Ankota provides software to improve the delivery of care outside the hospital, focusing on efficiency and care coordination. Ankota's primary focus is on Care Transitions for Readmission avoidance and on management of Private Duty non-medical home care. To learn more, please visit www.ankota.com or contact us.


 Spotify
  Pandora
  YouTube


Your Comments :