
Adult Day Care Activity Ideas to Keep Clients Engaged
Adult day care centers provide a vital service, offering a ...

Home care has been arguing about the same question for two decades: which numbers actually tell you whether the agency is healthy? The answer has moved twice. Stephen Tweed gave the industry its financial backbone, a set of CEO-level ratios reviewed monthly. Krystal Wilkinson took that thinking down to the floor, where a weekly scorecard is owned by the department head who can actually move the number. This article walks the arc from one to the other, shows what the result looks like on a single screen, and previews the work we are doing at Ankota to extend the same discipline into Medicaid and home and community based services.
My favorite home care podcast right now is not our own. It is Miriam Allred's Home Care Strategy Lab. Miriam used to host Vision: The Home Care Leaders' Podcast at Home Care Pulse, and the new show is sharper than anything else I listen to in this industry.
The episode that started this article is "The Only Home Care Scorecard You Need," from July 2026, in which Krystal Wilkinson, President of Adultcare Assistance Homecare in Arizona, walks through the KPIs her leadership team reviews every single week. I had the feeling you get when somebody says out loud a thing you have been circling for years.
What struck me was not the list. It was the altitude. Because the last time our industry had a canonical answer to "what should I be measuring," it came from Stephen Tweed and the Home Care CEO Forum, and it was a very different kind of answer. Stephen has been on our Home Care Heroes podcast twice, and his mastermind framework is the financial foundation the private duty industry has been benchmarking against since 2013.
These two frameworks are related. They are also thirteen years and about four thousand feet apart. Understanding how the second grew out of the first is the most useful thing an owner can do with an hour this month.
In my first management job at GE, we had a number we watched religiously and a dozen we looked at once a quarter, and the dozen were the ones that eventually hurt us. Nobody was accountable for any single one of them, so when one drifted, it drifted for a full quarter before it showed up in a room where somebody could do something about it. That is the whole problem in one sentence, and it took me years to say it that cleanly.
- Ken Accardi, CEO, Ankota
Home care's first widely adopted metric set came from Stephen Tweed and the Home Care CEO Forum, which he founded in 2013 when eight leaders from five companies met to form what they called the Five Million Dollar Mastermind Group. That group became the Top 5% Mastermind, now defined as agencies at or above the 95th percentile of annual revenue in the Home Care Pulse Benchmarking Study. Tweed's framework was built for the CEO, the board, and the investor, and it answers one question: how does your agency compare to the best private duty providers in the country?
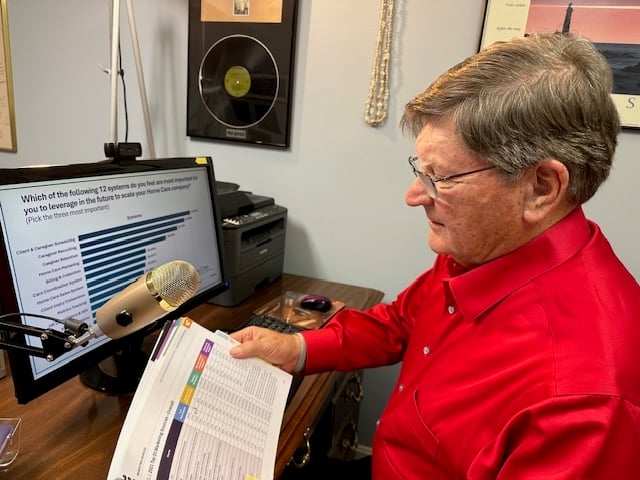
Five ratios do most of the work in that framework.
Inquiry-to-admission conversion rate, targeting 35 to 40 percent. Top-of-funnel sales efficiency: how many of the people who call you become clients.
Gross margin percentage, targeting 38 to 45 percent. The spread between what you bill and what you pay the caregiver. This is the single most important financial ratio in private duty, because it decides whether there is room to operate after overhead.
Revenue and hours per staffing coordinator, targeting 800 to 1,200 billable hours per internal coordinator. The operational leverage ratio, and the one that tells you whether office headcount is outrunning revenue.
Caregiver turnover and 90-day churn, treated as a financial liability rather than an HR statistic. Every caregiver lost inside 90 days costs recruiting spend, training time, and often a client relationship. Our breakdown of improving 90-day caregiver retention covers what is actually at stake in that window.
Client lifetime yield and high-hour retention. A client at 30 hours a week is worth far more over an episode than one at 8, so caseload mix matters as much as caseload count.
None of this is wrong. Every one of those numbers still belongs on a wall somewhere. The limitation, which Stephen has never pretended otherwise about, is arithmetic:
Caution
These are lagging indicators. If gross margin falls from 42 percent to 36 percent in the third quarter, you find out in October and the damage was done in July. You can diagnose it. You cannot prevent it with quarterly data.
That gap is the reason a second era exists.
The change is accountability, not arithmetic. Krystal Wilkinson's weekly scorecard takes the outcomes Tweed measures at the executive level and replaces each one with the leading activity that produces it, then assigns that activity to a named department head who reports on it every week. Her agency has been running in Arizona for close to 30 years as an independent, not a franchise, serving Phoenix, Scottsdale, Sun City and Tucson. She chairs the Arizona chapter of HCAOA, and the whole structure sits on EOS, the Entrepreneurial Operating System from Gino Wickman's Traction.
She uses a building analogy that has stuck with me since:
Sales is the contractor. They build the pipeline and fill the rooms. Care management is the property manager, protecting existing revenue by keeping clients satisfied. Scheduling is the elevator operator, matching the right caregivers to the right clients at the right times. Recruiting and HR is the foundation. Everything else sits on top of their ability to get qualified people in the door fast enough.
What she tracks follows that hierarchy, and the pattern repeats in every department: replace the outcome with the activity that causes it.
Tweed watches inquiry-to-admission conversion. Krystal watches the activity that produces conversions, specifically around 25 face-to-face referral visits a week with rehab facilities, hospital discharge planners, elder law attorneys and assisted living communities. She also tracks outbound referrals given, which almost nobody measures. If you send referrals to hospices, fiduciaries and home health providers, you are building reciprocal equity, and if you are not counting it you have no idea whether your referral relationships run in both directions or only one. The full relationship-development picture is in our pillar guide to home care growth and best practices.
Tweed's model tracks annual caregiver turnover, which is useful for understanding workforce health and useless for making a decision this week. Krystal tracks speed to hire, targeting under 7 to 9 days from application to completed orientation.
Tip
Good caregivers apply to several agencies in the same week. A seven-day hiring process and a three-week hiring process are not competing for the same candidates, because the three-week process is choosing from whoever is left. Speed to hire is a recruiting metric that behaves like a quality metric.
She pairs it with structured check-ins at 7, 30, 60 and 90 days. Most departures inside the first 90 days are preventable if somebody makes contact at the right moment, which is the subject of our guide to the first 100 days.
This is the one that surprised me most. Conventional growth thinking chases high-hour cases: the live-in, the 24/7 client, the complex 70-hour case. Krystal targets roughly 27 hours per week per client as the balance between revenue density and concentration risk.
The logic lands as soon as you hear it. A 70-hour client is a meaningful slice of agency revenue, and when that client discharges or dies or moves to a facility, the cliff is steep and the scheduling disruption ripples through your whole caregiver roster. A caseload averaging 27 hours absorbs individual discharges without a crisis.
Her other scheduling metric is the caregiver utilization score: actual scheduled hours divided by the hours that caregiver said they wanted when you hired them. Keeping people within about 10 percent of their stated target is one of the most direct levers on early churn, and one of the least tracked numbers in the industry. It is also a good argument for scheduling software built for home care, because desired hours versus assigned hours is only visible if something is capturing both.
A weekly home care scorecard is one screen, opened at the same time every Monday, that answers a single question: which department needs me this week. At Ankota we have been building exactly that, and the design below is where it currently stands. Six agency vitals across the top, one card per department underneath, each card showing the four numbers that department owns and a written status rather than a raw figure.
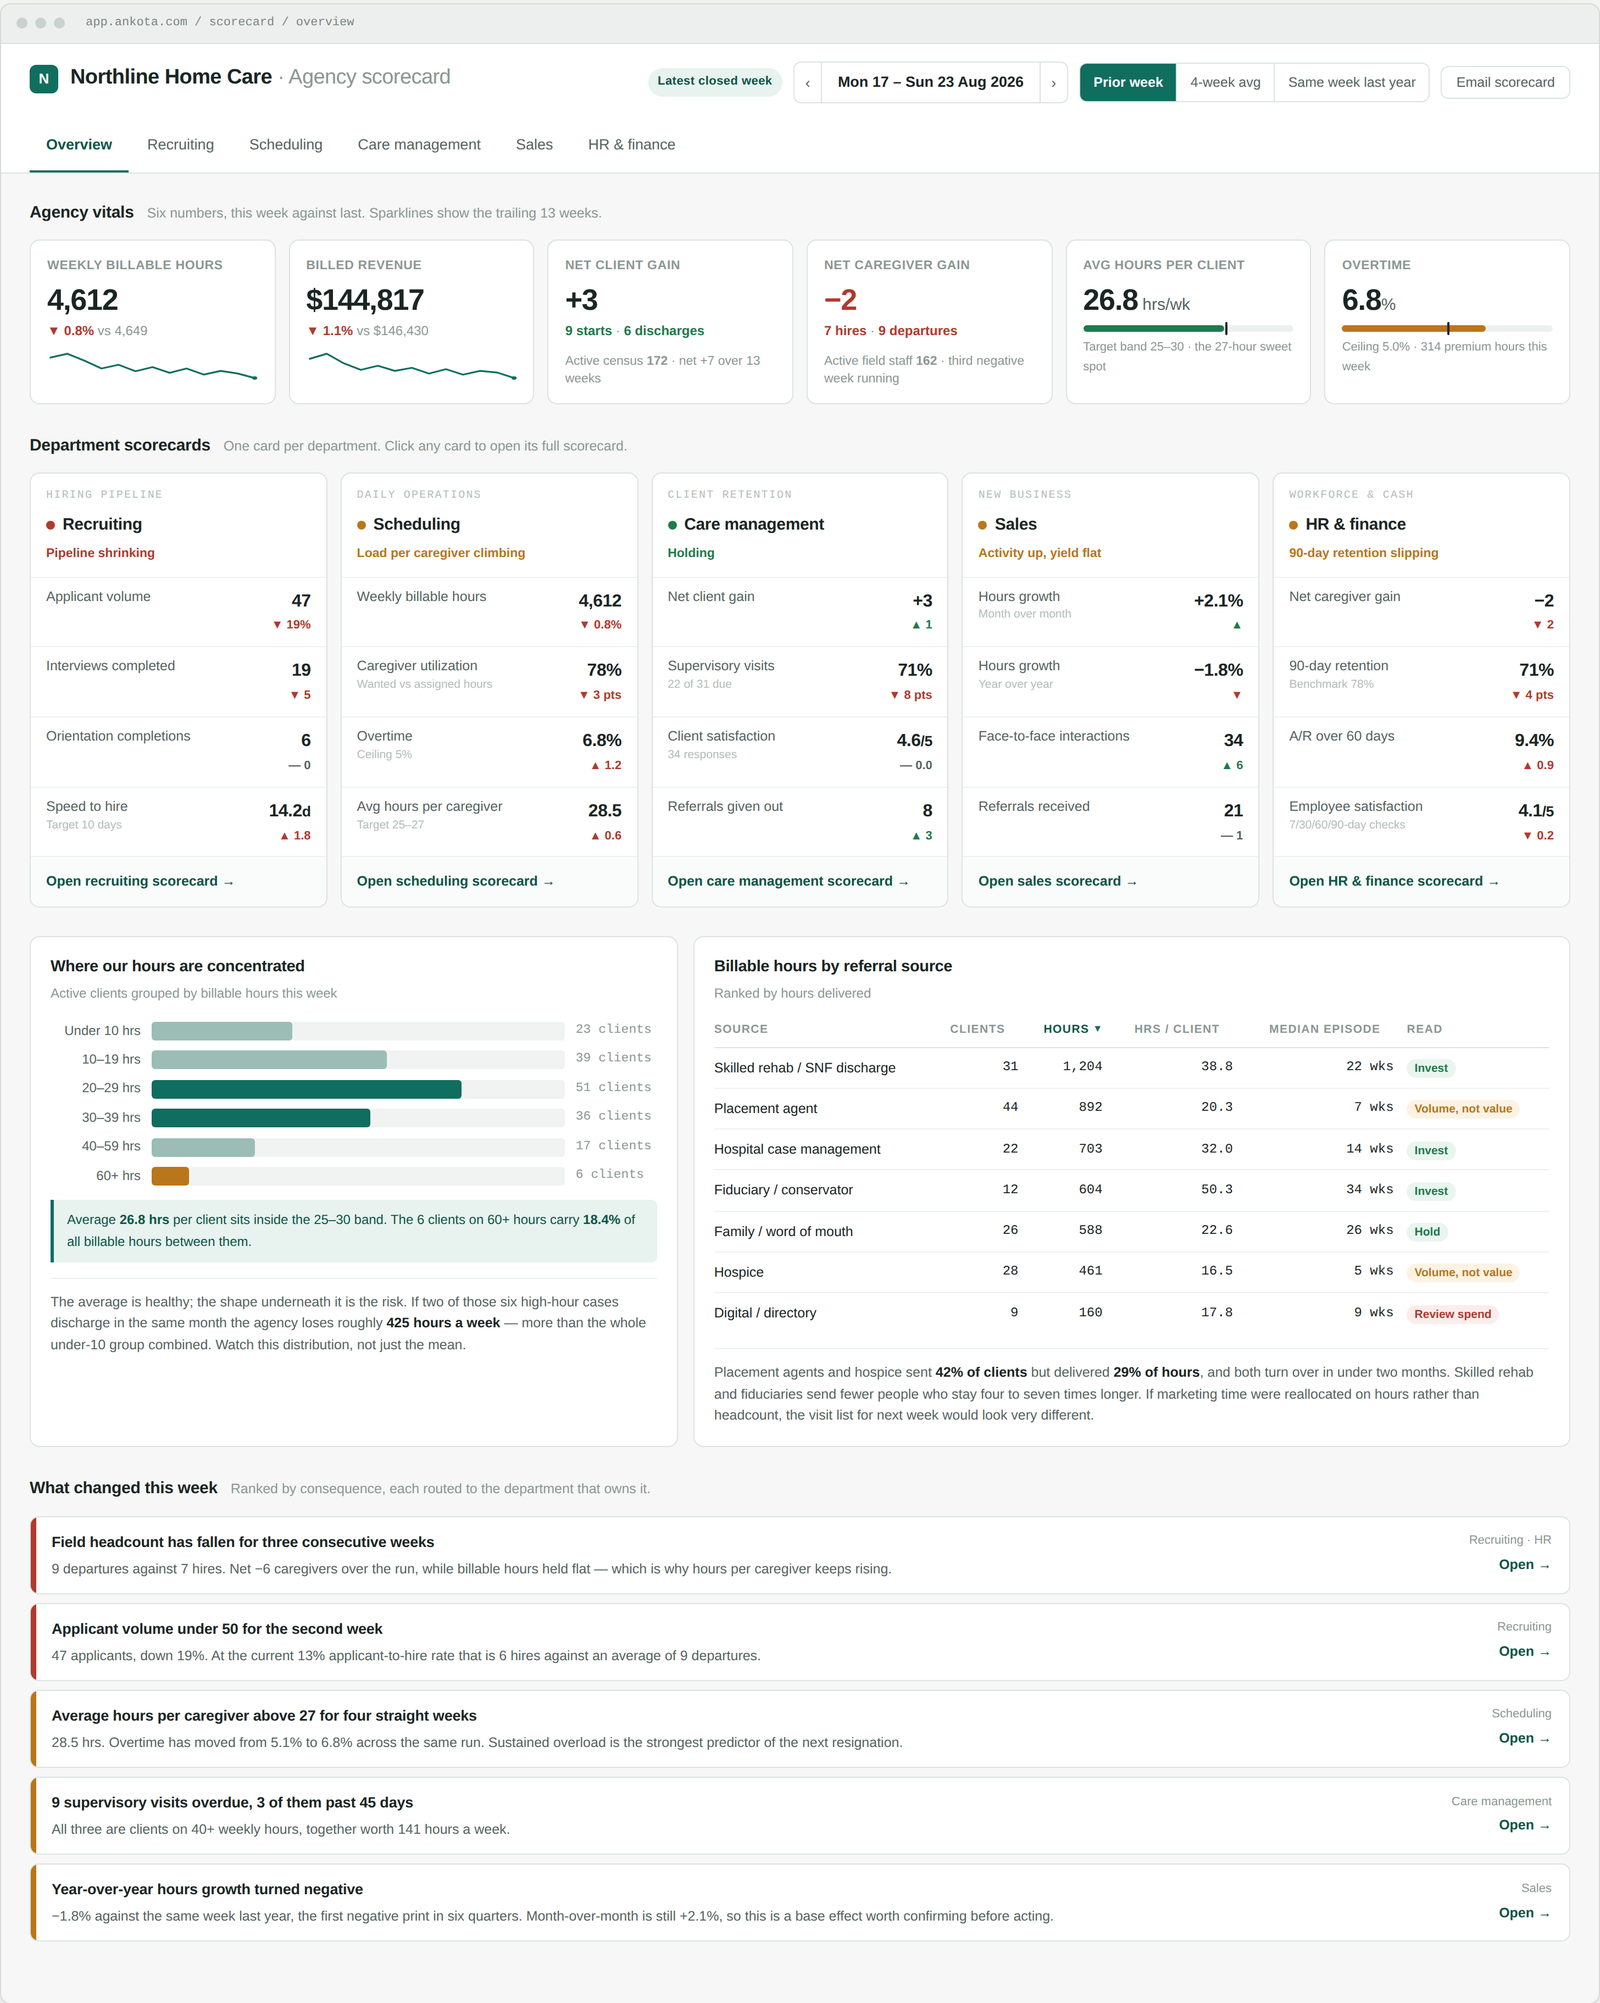
Three design decisions in that screen are worth naming, because they are what turn a report into a scorecard.
The unit is a closed week, not a date range. There is no date picker, because a scorecard you can slice arbitrarily stops being a scorecard. The value comes from the same numbers appearing in the same places every Monday until the team knows their shape by heart.
Every department status is written, not numeric. "Pipeline shrinking" and "load per caregiver climbing" are scannable in ten seconds in a way that a grid of percentages is not.
And the alerts connect departments to each other. Field headcount down three weeks while billable hours held flat is why hours per caregiver keeps rising, which is why overtime moved from 5.1 to 6.8 percent, which is the best available predictor of the next resignation. No single department scorecard can see that chain. That is the entire argument for having a master screen at all, and it is the reason we care about this conversation: those relationships only surface when scheduling, EVV, documentation and billing sit on one data layer instead of four. Agencies running disconnected systems can produce these numbers, but only through a reconciliation project, which means they are always looking at last month.
Roughly half of them, and the half that does not carry over is the half that decides whether a Medicaid program makes money. Both frameworks in this article were built for private duty. If you also run Medicaid home care, or waiver services for people with intellectual and developmental disabilities, the mechanics underneath the numbers change enough that applying a private pay scorecard will quietly mislead you.
The short version. In private pay, revenue is driven by sales, so you measure inquiries, referral visits and conversion. In Medicaid HCBS, revenue is capped by state rates and fixed authorizations, so there is no funnel to optimize. What replaces it is an authorization pipeline: authorized units, scheduled, delivered with EVV, clean claim submitted, remittance received. Profit is decided by how little leaks at each stage. Unbooked authorized hours cannot be banked or billed later, which is why experienced Medicaid operators schedule 100 percent of authorized units as a baseline and treat anything less as revenue already lost. None of that appears anywhere on a private duty scorecard, and the reverse is also true: face-to-face referral visits and inquiry conversion mean very little when beneficiaries have freedom of choice and anti-kickback rules govern what you can do with referral sources.
We have mapped all of it into a single reference, department by department, marking each metric as private pay, Medicaid HCBS, or both, with the operational objective it serves. It is free and there is no form.
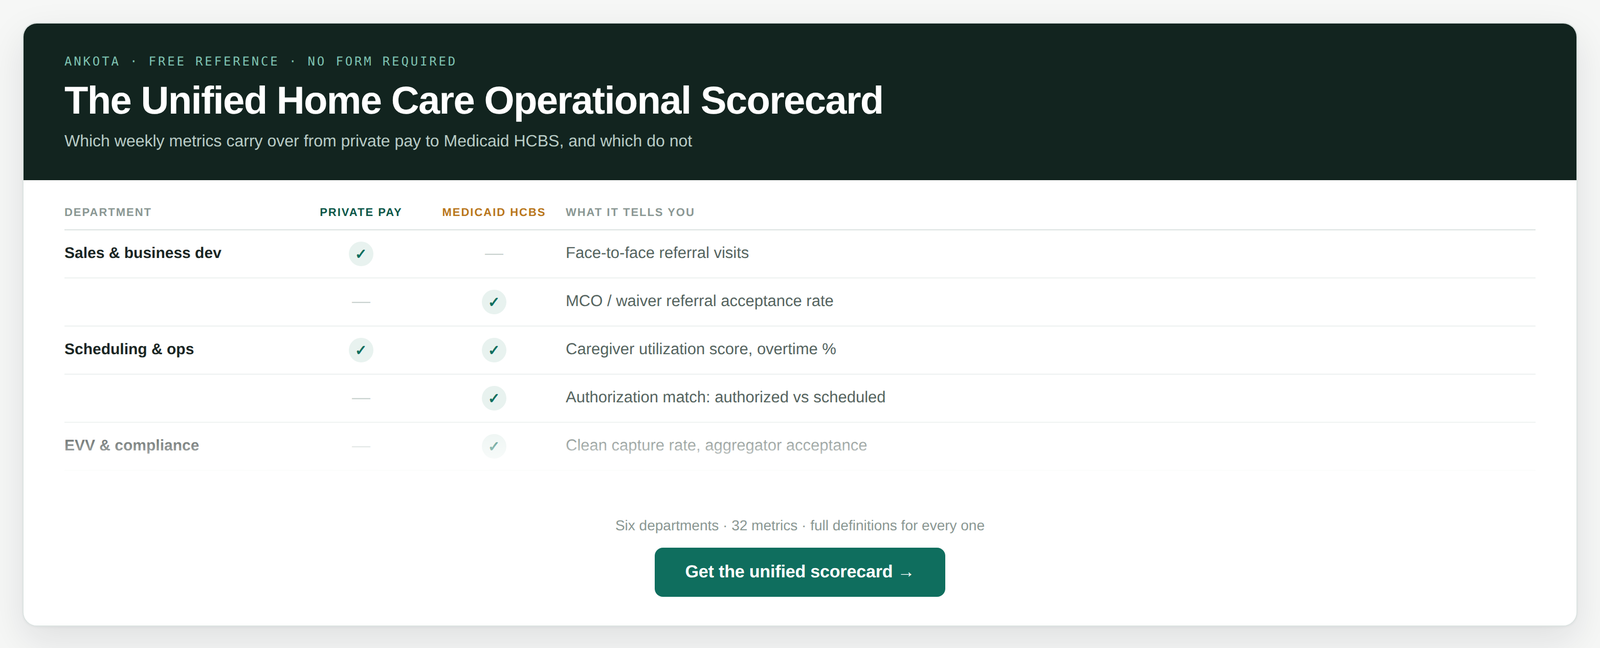
The full treatment of the Medicaid and HCBS side, including how the same weekly discipline applies to I/DD and self-direction programs, is the subject of our next article in this series. Until then, our guide to Medicaid waiver billing and avoiding HCBS denials covers where most of the financial complexity actually lives.
Most operators are using one of the three and missing what the other two would show them. The failure modes are consistent enough that we can name them.
The private duty founder schooled on Tweed's ratios has excellent financial discipline and no weekly visibility into the activity underneath the results. They learn in the quarterly review that turnover spiked. What they do not learn is that speed to hire slipped to 21 days in August, so they lost the strongest candidates to faster competitors for six weeks before anyone looked.
The operationally sharp agency running a weekly scorecard has tight accountability on workforce and scheduling, then expands into Medicaid and applies the same sales mindset to a business where it does not apply. They measure conversion on MCO referrals. They do not measure authorization utilization. They give up a slice of authorized revenue every month and nobody notices, because it is not on any dashboard.
The Medicaid-only provider has clean EVV capture and first-pass claims under control, and no gross margin framework, no utilization score, no speed to hire. Full compliance and chronic understaffing at the same time, because the recruiting side never got the discipline the billing side did. Our look at what home care's top 5% do differently keeps landing on the same pattern: the right metrics, at the right frequency, owned by the right person.
Every metric in this article is only as good as the data underneath it. Caregiver utilization needs scheduling software that captures desired hours as well as assigned hours and shows the gap. Clean EVV capture rates need visit verification wired into scheduling so exceptions surface before billing runs, not after a denial. First-pass claim rates need billing connected to EVV data so mismatches get caught before submission.
Ankota's connected platform links scheduling, EVV, documentation, billing and payroll into one operational data layer, so a weekly scorecard is a query rather than a weekend reconciliation project. For agencies running private pay and Medicaid HCBS side by side, that matters twice over, because the two lines share caregivers, share scheduling and share overhead even when their billing and compliance requirements have nothing in common.
If you want to see what this looks like against your own service mix, talk to our team. We will walk through the metrics you are tracking now, the ones your systems could be producing automatically, and what a Monday morning looks like when the whole picture is on one screen. You can also start with our home care software overview.
Stephen Tweed founded the Home Care CEO Forum in 2013, when eight leaders from five private duty companies formed the Five Million Dollar Mastermind Group. The framework centers on five financial ratios tracked at the executive level: inquiry-to-admission conversion of 35 to 40 percent, gross margin of 38 to 45 percent, 800 to 1,200 billable hours per staffing coordinator, 90-day caregiver churn treated as a financial liability, and client lifetime yield with an emphasis on high-hour retention. The groups benchmark against the Home Care Pulse Benchmarking Study, with the Top 5% Mastermind drawn from agencies at or above the 95th percentile of annual revenue.
Krystal Wilkinson, President of Adultcare Assistance Homecare in Arizona, described her weekly scorecard on the Home Care Strategy Lab podcast in July 2026. Her leadership team reviews a fixed set of KPIs every week across recruiting, scheduling, care management, sales and finance, each owned by a named department head. The distinguishing moves are tracking speed to hire instead of annual turnover, counting face-to-face referral visits and outbound referrals given rather than only conversions, tracking a caregiver utilization score against each caregiver's stated desired hours, and targeting roughly 27 hours per week per client. The structure sits on EOS, the Entrepreneurial Operating System.
Roughly 27 hours per week per client is the balance point between revenue density and concentration risk in private duty home care. High-hour cases at 60 or 70 hours a week generate significant revenue but create steep cliffs when they end, and the scheduling disruption spreads across the caregiver roster. A caseload averaging 27 hours spreads discharge risk across more clients and absorbs individual losses without a crisis. It also matches what many caregivers actually want, since a large share target 25 to 30 hours a week, which makes matching easier without pushing people into overtime.
Medicaid HCBS agencies work under fixed state rates with revenue capped by service authorizations, so the operational objective shifts from winning clients to capturing every authorized dollar. The metrics that matter are authorization utilization, targeting 100 percent of authorized units scheduled, delivery realization measuring delivered against scheduled hours, clean EVV capture rate, state aggregator acceptance rate, first-pass clean claim rate, and days sales outstanding by payer. Most private duty metrics, including inquiry-to-admission conversion and face-to-face referral visits, apply weakly or not at all, because beneficiaries have freedom of choice and anti-kickback rules limit referral marketing.
Monthly and quarterly financials are lagging measures, which means they report damage rather than prevent it. A weekly cadence works because the metrics on it are leading indicators that move before revenue does: applicant volume, speed to hire, caregiver utilization, overtime percentage, supervisory visits completed. A four-week run of rising hours per caregiver is visible weeks before the resignation it predicts, and weeks before that resignation reaches the profit and loss statement. Weekly review also makes ownership concrete, because a number reviewed every seven days has to belong to somebody.
The scorecard depends on scheduling, EVV, billing and workforce data being queryable together. Caregiver utilization needs scheduling that captures desired hours alongside assigned hours. Clean EVV capture needs verification integrated with the schedule so exceptions surface before billing. First-pass claim rates need billing connected to EVV data so mismatches are caught before submission rather than after denial. Agencies running separate systems for each function can still produce these numbers, but only by hand, which means the scorecard always shows data that is days or weeks old. Ankota's connected platform is built so these numbers are live.
Ankota's mission is to enable the Heroes who keep older and disabled people living at home to focus on care because we take care of the tech. If you need software for home care, EVV, I/DD Services, Self-Direction FMS, Adult Day Care centers, or Caregiver Recruiting, please Contact Ankota. And if you're ready to see how the most innovative agencies are using AI to empower their caregivers and automate the rest, meet your new companion at www.kota.care.

Ken is the founder and CEO of Ankota, a company that helps any organization that helps older or disabled people live independently in their home of choice. Having grown up with a disability and a passion for healthcare, this is Ken's mission
.png)
.png)



Trusted by home care agencies nationwide